[HFWWT 1]: Hello Forecasting World Walk Through 1
Identify top 5 stocks by S&P 500 sector ETF and use Alpha Vantage API to find tickers
In this post, we walk through how we built up the dataset we use for our revenue forecasting series. While this might be a bid dry, we hope to show the logic and hurdles we had to overcome so that readers can, if they want, reproduce the same dataset for themselves. Let's go!
There are number of financial APIs available to retail investors, with both free and paid versions. We could easily build something using a paid API, but that would not be reproducible for readers who don't want to fork out the dough for such a thing. A few of the available APIs are Alpha Vantage, SimFin, and Tiingo. We've used all these APIs in one form or another. We've also used others like FinnHub and Financial Modeling Prep (FMP). The FundamentalAnalysis package was the main way we interacted with FMP, which you can see in our post on forecasting net income using neural networks. However, that package was deprecated and ported to FinanceToolkit. We did not feel like learning another package to get the series going, so we won't use FMP or Finnhub. We may come back to these packages in the future. Whatever, the case we have three APIs to use and the ever useful yfinance package.
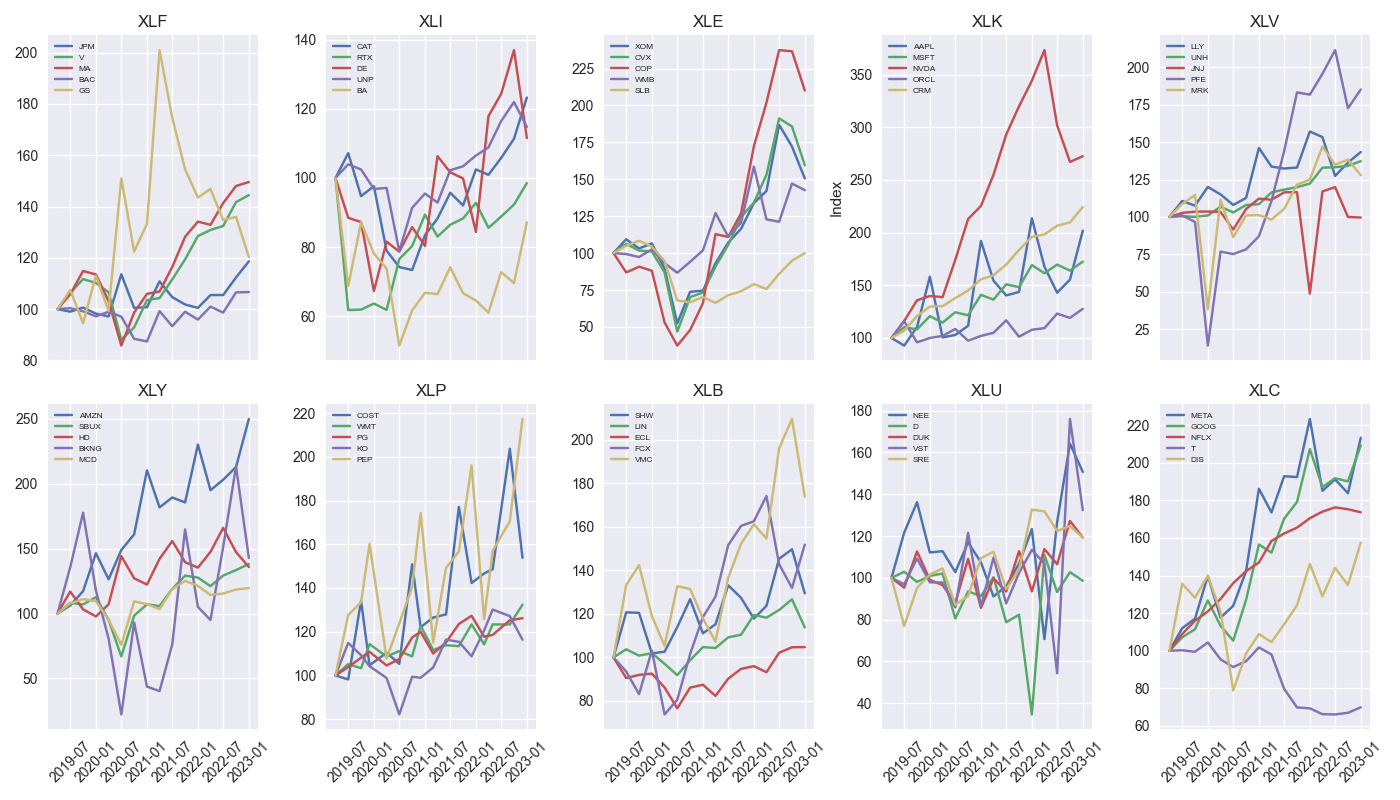
We first need to find the top 10 companies in each of the sectors. That is, the underlying components of the Select SPDRs® ETFs: ['XLF', 'XLI', 'XLE', 'XLK', 'XLV', 'XLY', 'XLP', 'XLB', 'XLU', 'XLC']. After loading our packages and setting our API keys, we instantiate the symbols and create a function to scrape the State Street website that has this data handy.
# Load packages
import os
import requests
import pandas as pd
import numpy as np
import yfinance as yf
import matplotlib.pyplot as plt
from matplotlib.ticker import FuncFormatter
import matplotlib as mpl
import time
import re
from dotenv import load_dotenv
import pickle

plt.style.use('seaborn-v0_8')
plt.rcParams["figure.figsize"] = (12,6)

# File save/load functions
def save_dict_to_file(data, filename):
    with open(filename, 'wb') as f:
        pickle.dump(data, f)

def load_dict_from_file(filename):
    with open(filename, 'rb') as f:
        return pickle.load(f)

# API keys
load_dotenv()
av_api_key = os.getenv('ALPHAVANTAGE_API_KEY')
ti_api_key = os.getenv('TIINGO_API_KEY')
simfin_api_key = os.getenv('SIMFIN_API_KEY')

etf_symbols = ['XLF', 'XLI', 'XLE', 'XLK', 'XLV', 'XLY', 'XLP', 'XLB', 'XLU', 'XLC']

def get_etf_holdings(etf_symbol):
    url = f"https://www.ssga.com/us/en/intermediary/etfs/the-financial-select-sector-spdr-fund-{etf_symbol.lower()}"

    # Send a GET request to fetch the webpage content
    response = requests.get(url)
    response.raise_for_status()  # Check for request errors

    # Read the HTML content into a list of DataFrames
    dfs = pd.read_html(response.text)

    # Iterate through the DataFrames to find the one containing the Top Ten Holdings
    for df in dfs:
        if all(col in df.columns for col in ['Name', 'Shares Held', 'Weight']):
            top_ten_holdings = df
            break

    top_ten_holdings.columns = ['name', 'shares', 'weight']
    top_ten_holdings['sector'] = etf_symbol
    top_ten_holdings = top_ten_holdings[['sector', 'name', 'shares', 'weight']]
    top_ten_holdings['shares'] = pd.to_numeric(top_ten_holdings['shares'], errors='coerce')
    top_ten_holdings['weight'] = top_ten_holdings['weight'].apply(lambda x: x.replace("%",''))
    top_ten_holdings['weight'] = pd.to_numeric(top_ten_holdings['weight'], errors='coerce')

    return top_ten_holdings

# Get holdings
all_holdings = []
for symbol in etf_symbols:
    holdings = get_etf_holdings(symbol)
    all_holdings.append(holdings)

# Convert holdings lists to dataframe
all_holdings = pd.concat([holding for holding in all_holdings], axis=0)

# Check correct datatypes
print(all_holdings.info())

# Save to csv if desired
# all_holdings.to_csv("path/to/data/all_holdings.csv", index=False)

# Load csv if desired
# all_holdings = pd.read_csv("path/to/data/all_holdings.csv")
A few notes on strategy. We use dotenv because it creates a nice way to access API keys stored in a .env file, which is a good way to store keys and secrets you don't want to share if working with production code or a local branch of repo that you'll eventually merge (or hope to!) with the main branch. You may notice while running the get_etf_holdings function you get a warning such as:
<stdin>:8: FutureWarning: Passing literal html to 'read_html' is deprecated and will be removed in a future version. To read from a literal string, wrap it in a 'StringIO' objectYou can safely ignore that. Some folks elect to import warnings to turn off such messages. I'd rather see them, but know to ignore them. When you print(all_holdings.info()) you should see the following:
<class 'pandas.core.frame.DataFrame'>
Index: 100 entries, 0 to 9
Data columns (total 4 columns):
 #   Column  Non-Null Count  Dtype
---  ------  --------------  -----
 0   sector  100 non-null    object
 1   name    100 non-null    object
 2   shares  100 non-null    int64
 3   weight  100 non-null    float64
dtypes: float64(1), int64(1), object(2)
memory usage: 3.9+ KB
It's critical that shares and weight are in some numeric format in order to sort those values. We took care of that in the get_etf_holdings function above. Next we group by sector and find the top 5 stocks by weight.
# Create Top 5 holdings dataframe
top_5 = all_holdings.groupby('sector')[['sector','name', 'weight']].apply(lambda x: x.nlargest(5, 'weight')).reset_index(drop=True)
print(top_5)
The resulting data frame has 50 rows, which we won't show below for space. Nonetheless, you should see something like the following:
   sector                          name  weight
0     XLB                     LINDE PLC   21.05
1     XLB       SHERWIN WILLIAMS CO/THE    8.17
2     XLB  AIR PRODUCTS + CHEMICALS INC    6.96
3     XLB                    ECOLAB INC    6.18
4     XLB          FREEPORT MCMORAN INC    5.98
-----------------------------------------------
44    XLV              MERCK + CO. INC.    4.91
45    XLY                AMAZON.COM INC   20.97
46    XLY                     TESLA INC   17.90
47    XLY                HOME DEPOT INC    6.29
48    XLY               MCDONALD S CORP    4.59
49    XLY          BOOKING HOLDINGS INC    4.31
If you are running this weeks or months after we first published the post, those companies will probably be different. But the key here is to confirm you're getting an output as close to what I'm getting.
Let's move on. While this is a very useful list, and assuming State Street doesn't block scraping or change the format of its website for the SPDRs anytime soon, this should also be a good function to get the names of the companies on which we want to collect data in the future. The main problem: no tickers!
We'll have to use the APIs we mentioned above to find the tickers associated with the companies. You'll also notice that some of the companies have odd formatting—for example, MCDONALD S CORP or SHERWIN WILLIAMS CO/THE. This will require some text cleaning/regex. This is definitely not the most interesting part of the data wrangling process. Indeed, we find working with regex mostly opaque and a frustrating experience best avoided.
Let's start with Alpha Vantage. It has a symbol search endpoint, which we initially thought could work. Note: if you're on the free version, there is a daily API call limit of 25 requests at the time of writing, so you might want to take my word for it rather that waste the resource. Spoiler alert: this endpoint does not work so well for our purposes.
# Create function to extract the name from the top_5 holdings dataframe and change "+" to "&" to match conventions in APIs
def extract_words(name: str) -> str:
    if "+" in name:
        parts = name.split()
        plus_index = parts.index("+")
        name = " ".join([x for x in parts[:plus_index]]) + " & " + " ".join([x for x in parts[plus_index + 1:]])
    name = name.replace("CO/THE", "")
    return name

# Create function to find ticke associated with
def get_ticker_alpha_vantage(company_name: str, api_key: str|None) -> str:
    url = f'https://www.alphavantage.co/query?function=SYMBOL_SEARCH&keywords={company_name}&apikey={api_key}'
    r = requests.get(url)
    data = r.json()
    dat = pd.DataFrame(data['bestMatches'])
    ticker = dat.loc[(dat["4. region"] == 'United States') & (dat['8. currency'] == 'USD') & (dat["1. symbol"].str.len() <= 4), "1. symbol"].values[0]
    return ticker

# Get company names
companies = top_5['name'].to_list()
companies = [extract_words(name) for name in companies]

tickers_av = []
missing_av = []

for company in companies:
    try:
        ticker = get_ticker_alpha_vantage(company, av_api_key)
        tickers.append(ticker)
    except Exception as e:
        missing_av.append(company)
        print(f"Error for {company}: {e}")

assert len(tickers_av) + len(missing_av) == 50, "You lost some tickers!"
if len(missing_av) > 0:
    print(f"Missing {len(missing_av)} tickers!")
else:
    print("Good to go!")
If you do run all of the above functions and loops, you'll notice that we're wearing a belt and suspenders with the except and assert logic. The except is there as a placeholder to ensure we can iterate through all the tickers without the for loop failing. The assert is there if for some reason the two lists didn't get all 50 companies. Finally, the last condition is to check how many missing tickers we actually have. That should print out the following: Missing 34 tickers! (Note: you may get one or two more or less than this.) Whatever the case, that's too many for our purposes—almost 70% missing. We could, of course, fix some of the regex and try again, or simply move on to the next API with the hope that it is in fact better. Since we’re not committed to one API or another, we’ll look at Tiingo in the next walk-through. Stay tuned!