


HFW 8: ARIMA's bad luck
ARIMA's higher complexity does not appear to yield better performance
Having combined the autoregressive and moving average models in our last post, we're now ready to put the I in ARIMA. For those not familiar, that stands for autoregressive integrated moving average. The intuition behind this model is the following. Suppose you're at a St. Patrick's Day parade making a bet with some of your friends on when the next float will pass by. You might have noticed that each float is about 5 minutes after the last. So, using the past, the autoregressive part, you'd forecast that the next float will float by at whatever the last arrival time was plus 5 minutes. However, one of your friends might mention that such spacing isn't always accurate. The floats get delayed due to essential cross street traffic or some particularly festive revelers decide dancing in the street would be a good idea. Hence, you wouldn’t want to rely only on past float passing intervals because those disturbances throw off predictions. Instead, you smooth things out by considering recent random shocks (like short-term delays or accelerations)—the moving average part.
Finally, another friend might mention that even with past arrival times and occasional delays, there are also ebbs and flows in the pace, which need to be taken into account. A succession of big floats may arrive at pretty evenly spaced intervals, while pipe bands are closer or further apart depending on the walking pace of the major-domo. In this case, you should also look at the differences between arrival times, as the parade slows down or speeds up—the integrated part. In yet another example of odd naming, even though the model uses the differences in the data to build forecasts, these differences need to be compiled—i.e., integrated—at the end to make the prediction. Hence, integrated not differenced. But what’s wrong with the sound of ARDMA? We digress.
With that briefest of introductions over, let's look at the results. By now, you should be familiar with the steps, so we'll just show the scaled RMSE graph of the ARIMA model below. Here we use an ARIMA (1,1,1) model, which means a single period lag, a single period difference, and a single prior period error.

As with all the other models, XLK stands out as having the highest error. XLV, XLE, and XLY are notably error prone too. We saw both the AR(1) and MA(1) models perform poorly on XLE and XLV, so that might explain the ARIMA performance. But XLY, the consumer discretionary ETF, did not suffer as much for those models. Indeed, such poor performance is a bit of a surprise when we look at all the models below.

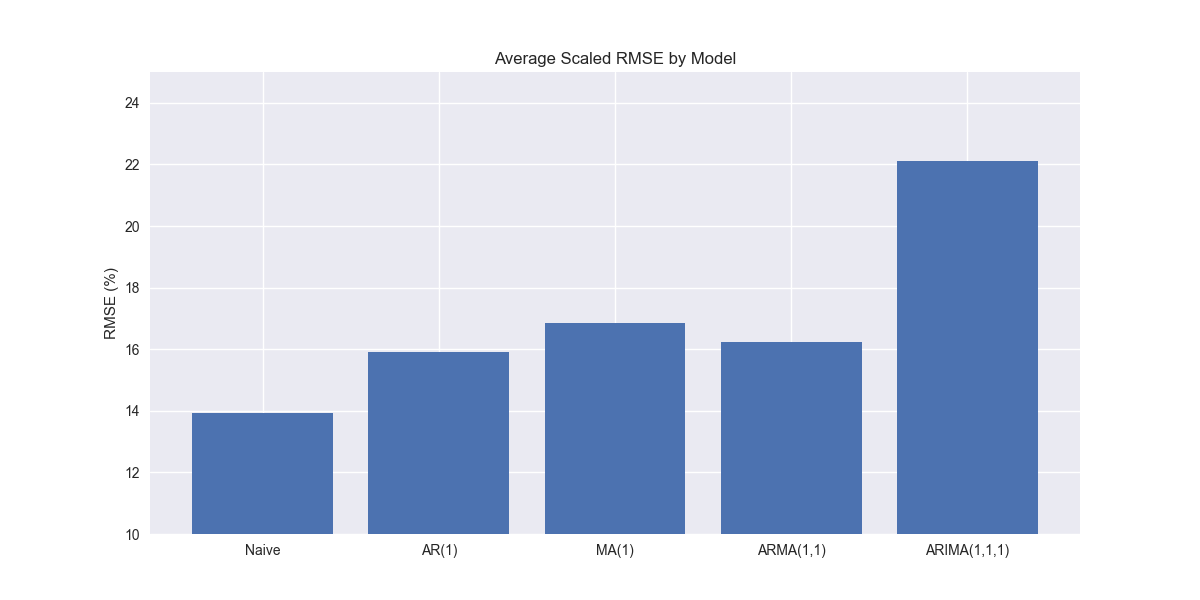
As is clear, the ARIMA model performs noticeably worse on XLY than benchmark models and the MA and ARMA models, which are as good as, if not better than, the naïve. Indeed, it might seem remarkable that the more sophisticated model (e.g., ARIMA) performs worse than the less sophisticated ones in aggregate, as shown in the graph below.
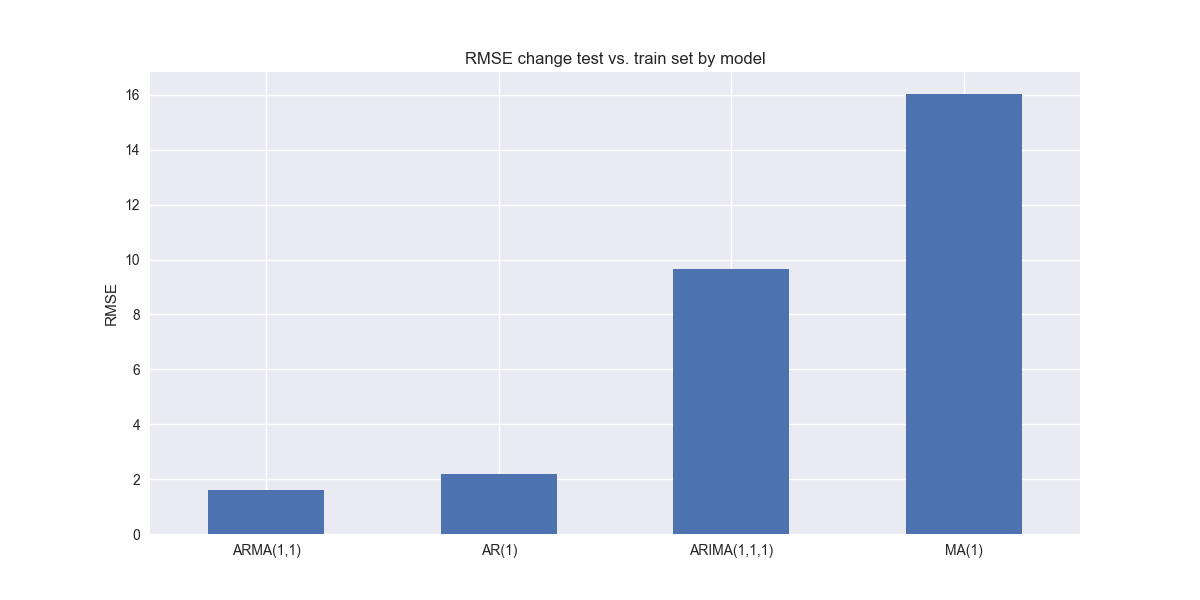
Finding the root cause of this poor performance is not trivial. So we'll save that for another post. That said, we'll throw a few potential ideas out there. First, since the ARIMA model is more complex than the others it may indeed be overfitting. When we compare the change in RMSE for train vs. test sets on the different models, we see that the ARIMA suffers the second largest increase in error. The MA model suffers the highest, so this is not an entirely satisfactory answer.
Second, heterogeneity across companies—something we've already discussed in previous posts—may mean that the ARIMA model only performs well for specific companies. If we look at the top 20 highest errors for ARIMA, it notably performs worse on some companies the feature relatively low errors with the other models—e.g., Disney, Goldman Sachs, and Union Pacific.

Finally, there are other possibilities—short time horizons, structural breaks, and seasonality to name a few—that might also be the cause. But we’ll save looking at those factors for another post
Over to you. Should we spend more time identifying the causes of the poor performance or push on to other models—ARCH and GARCH, for example? Let us know in the comments below or send an email to content at optionstocksmachines dot com. Stay tuned!
Code below.
# Load packages
import pandas as pd
import numpy as np
from datetime import datetime, timedelta
import statsmodels.api as sm
from statsmodels.tsa.ar_model import AutoReg
from statsmodels.tsa.arima.model import ARIMA
from statsmodels.tsa.statespace.sarimax import SARIMAX
import matplotlib.pyplot as plt
from matplotlib.ticker import FuncFormatter
import matplotlib as mpl
import pickle
from matplotlib.lines import Line2D
import seaborn as sns

# Assign chart style
plt.style.use('seaborn-v0_8')
plt.rcParams["figure.figsize"] = (12,6)

# Handy functions
def save_dict_to_file(data, filename):
    with open(filename, 'wb') as f:
        pickle.dump(data, f)

def load_dict_from_file(filename):
    with open(filename, 'rb') as f:
        return pickle.load(f)

def get_rmse_dataframe(model_dict, rev_dict, start, end, dynamic=True):
    err_df = pd.DataFrame(columns = ['sector', 'ticker', 'actual', 'predicted'])
    count = 0
    for key in model_dict:
        for ticker in model_dict[key]:
            try:
                y_act = rev_dict[key][ticker].values
                if dynamic:
                    y_pred = model_dict[key][ticker].predict(start,end, dynamic=False).values
                else:
                    y_pred = model_dict[key][ticker].predict(start,end).values
            except ValueError as e:
                print(f"{ticker} fails due to {e}")
                y_act = np.nan
                y_pred = np.nan

            err_df.loc[count] = [key.upper(), ticker, y_act, y_pred]
            count += 1

    for ticker in err_df['ticker'].to_list():
        actual = err_df.loc[err_df['ticker']==ticker, 'actual'].values[0]
        predicted = err_df.loc[err_df['ticker']==ticker, 'predicted'].values[0]
        rmse = np.sqrt(np.mean((actual - predicted)**2))
        rmse_scaled = rmse/actual.mean()
        err_df.loc[err_df['ticker']==ticker, 'rmse'] = rmse
        err_df.loc[err_df['ticker']==ticker, 'rmse_scaled'] = rmse_scaled

    return err_df

def get_rmse_scaled(series):
    return np.sqrt(np.mean((series['actual']-series['predicted'])**2))/np.mean(series['actual'])

def flatten_df(dataf: pd.DataFrame, group_name:str, cols:list) -> pd.DataFrame:
    df_grouped = dataf.groupby(group_name)[cols].agg(list)

    for col in cols:
        df_grouped[col] = df_grouped[col].apply(lambda x: np.concatenate(x))

    df_long = df_grouped.apply(pd.Series.explode).reset_index()

    return df_long

# Symbols used
etf_symbols = ['XLF', 'XLI', 'XLE', 'XLK', 'XLV', 'XLY', 'XLP', 'XLB', 'XLU', 'XLC']

ticker_list = ["SHW", "LIN", "ECL", "FCX", "VMC",
               "XOM", "CVX", "COP", "WMB", "SLB",
               "JPM", "V", "MA", "BAC", "GS",
               "CAT", "RTX", "DE", "UNP", "BA",
               "AAPL", "MSFT", "NVDA", "ORCL", "CRM",
               "COST", "WMT", "PG", "KO", "PEP",
               "NEE", "D", "DUK", "VST", "SRE",
               "LLY", "UNH", "JNJ", "PFE", "MRK",
               "AMZN", "SBUX", "HD", "BKNG", "MCD",
               "META", "GOOG", "NFLX", "T", "DIS"
]

xlb = ["SHW", "LIN", "ECL", "FCX", "VMC"]
xle = ["XOM", "CVX", "COP", "WMB", "SLB"]
xlf = ["JPM", "V", "MA", "BAC", "GS"]
xli = ["CAT", "RTX", "DE", "UNP", "BA"]
xlk = ["AAPL", "MSFT", "NVDA", "ORCL", "CRM"]
xlp = ["COST", "WMT", "PG", "KO", "PEP"]
xlu = ["NEE", "D", "DUK", "VST", "SRE"]
xlv = ["LLY", "UNH", "JNJ", "PFE", "MRK"]
xly = ["AMZN", "SBUX", "HD", "BKNG", "MCD"]
xlc = ["META", "GOOG", "NFLX", "T", "DIS"]

sectors = [xlf,  xli,  xle,  xlk, xlv,  xly, xlp, xlb, xlu, xlc]

# Sector dictionary
sector_dict = {symbol.lower(): tickers for symbol, tickers in zip(etf_symbols, sectors)}

# Load data from disk
# See Code Walk-Throughs for how we built the data set
df_sector_dict = load_dict_from_file("path/to/data/simfin_df_rev_dict.pkl")

# Create functions for indexing
def create_index(series):
    if series.iloc[0] > 0:
        return series/series.iloc[0] * 100
    else:
        return (series - series.iloc[0])/-series.iloc[0] * 100

# Clean dataframes
df_rev_index_dict = {}
for key in sector_dict:
    temp_df = df_sector_dict[key].copy()
    col_1 = temp_df.columns[0]
    temp_df = temp_df[[col_1] + [x for x in temp_df.columns if 'revenue' in x]]
    temp_df.columns = ['date'] + [x.replace('revenue_', '').lower() for x in temp_df.columns[1:]]
    temp_idx = temp_df.copy()
    temp_idx[[x for x in temp_idx if 'date' not in x]] = temp_idx[[x for x in temp_idx if 'date' not in x]].apply(create_index)
    df_rev_index_dict[key] = temp_idx

# Create train/test dataframes
df_rev_train_dict = {}
df_rev_test_dict = {}
for key in df_rev_index_dict:
    df_out = df_rev_index_dict[key]
    df_rev_train_dict[key] = df_out.loc[df_out['date'] < "2023-01-01"]
    df_rev_test_dict[key] = df_out.loc[df_out['date'] >= "2023-01-01"]

# Create model dictionary
ar_models = {}
lags = 1
diffs = 0
mas = 0
for key in df_rev_train_dict:
    tickers = [x.lower() for x in sector_dict[key]]
    df_train = df_rev_train_dict[key]
    ar_models[key] = {}
    for ticker in tickers:
        try:
            model = SARIMAX(df_train[ticker], order=(lags, diffs, mas),
                          trend='ct',
                          enforce_stationarity=False,
                          enforce_invertibility=False
                          ).fit(method='powell',
                                transformed=False,
                                maxiter=100)
        except ValueError as e:
            print(f"{ticker} fails due to {e}")

        ar_models[key][ticker] = model

# RMSE dataframe
ar_err_df = get_rmse_dataframe(ar_models, df_rev_test_dict, start=16, end=19)

# Clean and flatten ar_err_df
ar_df_long = flatten_df(ar_err_df, 'sector', ['actual', 'predicted'])

# Create model dictionary
ma_models = {}
lags = 0
diffs = 0
mas = 1
for key in df_rev_train_dict:
    tickers = [x.lower() for x in sector_dict[key]]
    df_train = df_rev_train_dict[key]
    ma_models[key] = {}
    for ticker in tickers:
        try:
            model = ARIMA(df_train[ticker], order=(lags, diffs, mas),
                          trend='ct',
                          enforce_stationarity=False,
                          enforce_invertibility=False
                          ).fit()
        except ValueError as e:
            print(f"{ticker} fails due to {e}")

        ma_models[key][ticker] = model

# RMSE dataframe
ma_err_df = get_rmse_dataframe(ma_models, df_rev_test_dict, start=16, end=19)

# Clean and flatten ar_err_df
ma_df_long = flatten_df(ma_err_df, 'sector', ['actual', 'predicted'])

# Load comparison dataframe
comp_df = pd.read_pickle("hello_world/data/comp_df.pkl")
ma = ma_df_long.groupby('sector')[['actual', 'predicted']].apply(get_rmse_scaled).reset_index().rename(columns={0:'ma'})
comp_df = comp_df.merge(ma, how="left", on='sector')

comp_all_df = pd.read_pickle("hello_world/data/comp_all_df.pkl")
ma_ticker = ma_ticker_long.groupby('ticker')[['actual', 'predicted']].apply(get_rmse_scaled).reset_index().rename(columns={0:'ma'})
comp_all_df = comp_all_df.merge(ma_ticker, how="left", on='ticker')

# ARMA (1,1)
arma_models = {}
lags = 1
diffs = 0
mas = 1
mle_retval_dict = {}
for key in df_rev_train_dict:
    tickers = [x.lower() for x in sector_dict[key]]
    df_train = df_rev_train_dict[key]
    arma_models[key] = {}
    mle_retval_dict[key] = {}
    for ticker in tickers:
        try:
            # model = ARIMA(df_train[ticker], order=(lags, diffs, mas), trend='c').fit()
            model = SARIMAX(df_train[ticker], order=(lags, diffs, mas),
                          trend='ct',
                          enforce_stationarity=False,
                          enforce_invertibility=False
                          ).fit(method='powell',
                                transformed=False,
                                maxiter=100)
        except ValueError as e:
            print(f"{ticker} fails due to {e}")

        arma_models[key][ticker] = model
        if not model.mle_retvals['converged']:
            mle_retval_dict[key][ticker] = model.mle_retvals

# RMSE dataframe
arma_err_df = get_rmse_dataframe(arma_models, df_rev_test_dict, start=16, end=19)

# Clean and flatten ar_err_df
arma_df_long = flatten_df(arma_err_df, 'sector', ['actual', 'predicted'])

# Add to comparison dataframe
arma = arma_df_long.groupby('sector')[['actual', 'predicted']].apply(get_rmse_scaled).reset_index().rename(columns={0:'arma'})
comp_df = comp_df.merge(arma, how="left", on='sector')

# Group by tickers
arma_ticker_long = flatten_df(arma_err_df, 'ticker', ['actual', 'predicted'])

# Add to individual performance dataframe
arma_ticker = arma_ticker_long.groupby('ticker')[['actual', 'predicted']].apply(get_rmse_scaled).reset_index().rename(columns={0:'arma'})
comp_all_df = comp_all_df.merge(arma_ticker, how="left", on='ticker')

# ARIMA (1,1, 1)
arima_models = {}
lags = 1
diffs = 1
mas = 1
mle_retval_dict = {}
for key in df_rev_train_dict:
    tickers = [x.lower() for x in sector_dict[key]]
    df_train = df_rev_train_dict[key]
    arima_models[key] = {}
    mle_retval_dict[key] = {}
    for ticker in tickers:
        try:
            model = SARIMAX(df_train[ticker], order=(lags, diffs, mas),
                          trend='ct',
                          enforce_stationarity=False,
                          enforce_invertibility=False
                          ).fit(method='powell',
                                transformed=False,
                                maxiter=100)
        except ValueError as e:
            print(f"{ticker} fails due to {e}")

        arima_models[key][ticker] = model
        if not model.mle_retvals['converged']:
            mle_retval_dict[key][ticker] = model.mle_retvals

# RMSE dataframe
arima_err_df = get_rmse_dataframe(arima_models, df_rev_test_dict, start=16, end=19)
# Clean and flatten ar_err_df
arima_df_long = flatten_df(arima_err_df, 'sector', ['actual', 'predicted'])

# Graph scaled RMSE by sector
(arima_df_long.groupby('sector')[['actual', 'predicted']].apply(get_rmse_scaled).sort_values(ascending=True)*100).plot(kind='bar', rot=0)
plt.xlabel('')
plt.ylabel('RMSE (%)')
plt.title('Scaled RMSE by Sector for ARIMA(1,1,1) Models')
plt.show()

# Add to comparison dataframe
arima = arima_df_long.groupby('sector')[['actual', 'predicted']].apply(get_rmse_scaled).reset_index().rename(columns={0:'arima'})
comp_df = comp_df.merge(arima, how="left", on='sector')

# Plot RMSE by sector and model
(comp_df.set_index('sector')[['naive', 'lr', 'ma','arma', 'arima']].sort_values('naive')*100).plot(kind='bar', rot=0)
plt.xlabel('')
plt.ylabel('RMSE (%)')
plt.ylim(0, 110)
plt.legend(['Naive', 'AR(1)', 'MA(1)', 'ARMA(1,1)', 'ARIMA(1,1,1)'], loc='upper center', ncol=5)
plt.title('Scaled RMSE Comparisons by Sector and Model')
plt.show()

# Group by tickers
arima_ticker_long = flatten_df(arima_err_df, 'ticker', ['actual', 'predicted'])

# Add to individual performance dataframe
arima_ticker = arima_ticker_long.groupby('ticker')[['actual', 'predicted']].apply(get_rmse_scaled).reset_index().rename(columns={0:'arima'})
comp_all_df = comp_all_df.merge(arima_ticker, how="left", on='ticker')
comp_all_df.head()

# Plot mean RMSE
mean_rmses = (comp_all_df[['naive', 'lr', 'ma', 'arma', 'arima']].mean()*100).values
plt.bar(np.arange(5), mean_rmses) #type: ignore
plt.xticks(np.arange(5),['Naive', 'AR(1)', 'MA(1)', 'ARMA(1,1)', 'ARIMA(1,1,1)'])
plt.xlabel("")
plt.ylabel('RMSE (%)')
# plt.legend()
plt.ylim(10,25)
plt.title('Average Scaled RMSE by Model')
plt.show()

# Top 20 by ARIMA
n_large = [x.upper() for x in comp_all_df.nlargest(10,"arima")['ticker'].to_list()]
(comp_all_df.nlargest(10, "arima").set_index("ticker")*100).plot(kind='bar', rot=0)
plt.xlabel('')
plt.xticks(np.arange(10), n_large)
plt.ylabel('Scaled RMSE (%)')
plt.legend(['Naive', 'AR(1)', 'MA(1)', 'ARMA(1,1)','ARIMA(1,1,1)'], loc='upper center', ncol=5)
plt.title('Top 20% highest error rate by company and Model')
plt.show()

# Get training errors
ar_train_err = get_rmse_dataframe(ar_models, df_rev_train_dict, start=0, end=15)
ar_train_long = flatten_df(ar_train_err, 'sector', ['actual', 'predicted'])

ma_train_err = get_rmse_dataframe(ma_models, df_rev_train_dict, start=0, end=15)
ma_train_long = flatten_df(ma_train_err, 'sector', ['actual', 'predicted'])

arma_train_err = get_rmse_dataframe(arma_models, df_rev_train_dict, start=0, end=15)
arma_train_long = flatten_df(arma_train_err, 'sector', ['actual', 'predicted'])

arima_train_err = get_rmse_dataframe(arima_models, df_rev_train_dict, start=0, end=15)
arima_train_long = flatten_df(arima_train_err, 'sector', ['actual', 'predicted'])

# AR train/test comparisons
ar_comp = pd.merge(ar_train_err.groupby('sector')[['rmse','rmse_scaled']].mean(),ar_err_df.groupby('sector')[['rmse','rmse_scaled']].mean(),
                     how='left', left_on='sector', right_on='sector', suffixes=("_train", "_test"))

# MA train/test comparisons
ma_comp = pd.merge(ma_train_err.groupby('sector')[['rmse','rmse_scaled']].mean(),ma_err_df.groupby('sector')[['rmse','rmse_scaled']].mean(),
                   how='left', left_on='sector', right_on='sector', suffixes=("_train", "_test"))

# ARMA train/test comparisons
arma_comp = pd.merge(arma_train_err.groupby('sector')[['rmse','rmse_scaled']].mean(),arma_err_df.groupby('sector')[['rmse','rmse_scaled']].mean(),
                     how='left', left_on='sector', right_on='sector', suffixes=("_train", "_test"))


# ARIMA train/test comparisons
arima_comp = pd.merge(arima_train_err.groupby('sector')[['rmse','rmse_scaled']].mean(),arima_err_df.groupby('sector')[['rmse','rmse_scaled']].mean(),
                      how='left', left_on='sector', right_on='sector', suffixes=("_train", "_test"))

# Aggregate comparisons
df_rmse_err = []
for comp in [ar_comp, ma_comp, arma_comp, arima_comp]:
    df_rmse_err.append(comp['rmse_test']- comp['rmse_train'])

df_rmse_err = pd.concat([x for x in df_rmse_err], axis=1)
df_rmse_err.columns = ['ar', 'ma', 'arma', 'arima']

# Plot
df_rmse_err.mean().sort_values().plot(kind='bar', rot=0)
plt.ylabel('RMSE')
plt.title('RMSE change test vs. train set by model')
plt.show()