


BOTW 16: Oil vs. Oil
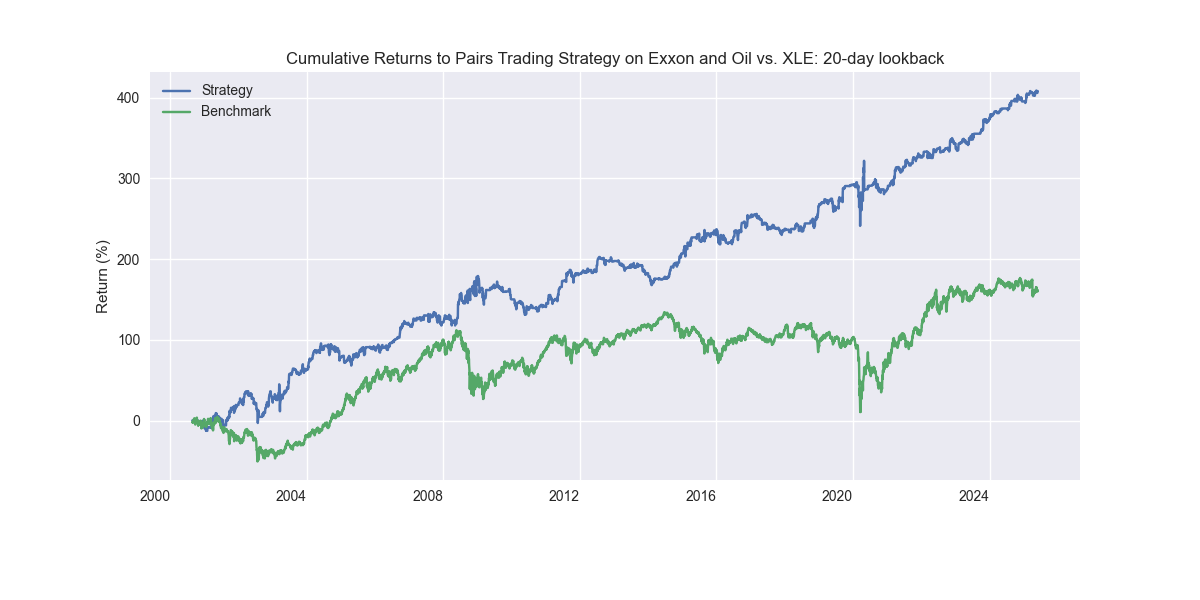
Pairs trading big oil companies Exxon or Chevron vs. oil significantly outperforms XLE and the S&P.
With oil jumping almost 8% on Friday due to tensions in the Middle East, one wonders how that affects the equities of big oil companies. In an oil vs. big oil comparison, we note that Chevron and Exxon were only up less than 1% and around 2%, respectively. XLE, the Energy sector ETF, was up almost 2% , while Occidental Petroleum was up close to 4%. Strange? Not really. The lack of follow through on these stocks and ETFs is simply that equities are discounting mechanisms. Oil or other fossil fuels can spike due to geopolitics or supply shocks; but the equity value of energy equities is the discounted value of future cash flows. And most of that value resides in the terminal value of the discounted cash flow. Day-to-day spikes rarely alter the long-term price of a commodity and hence the terminal value of the equities that extract or refine that commodity. Since this our backtest of the week, it naturally begs the question whether differences between the equity and underlying commodity can be exploited in some way. We've looked at oil before in BOTW 3: Rolling a Pair. That post compared oil service companies to the commodity. Today, we’ll look at some integrated (aka BIG) oil companies vs. the commodity. Let's go!
First, we construct a pairs trade between Exxon and Oil. As in past pairs trade backtests, we use a rolling regression with a lookback period of x number of trading days (20 or four weeks, roughly, in this case). We then calculate the p-value of the cointegration of the returns to the two assets for the lookback period. If it is below the 5% level of significance we enter the trade. When the z-score on the current spread1 vs. the historical spread exceeds -/+ 1 on absolute basis we go long/short the spread and hold until the z-score drops to -/+ 0.25. These are, of course, hyperparameters that we can tune to overfit, we mean cross-validate should we want to in the future. Let's look at the results of the strategy vs. the sector ETF, XLE.
Keep reading with a 7-day free trial
Subscribe to Options, Stocks, Machines on Substack to keep reading this post and get 7 days of free access to the full post archives.