
HFW 21: Parsing AutoETS
Multiplicative errors appear the most prevalent across the AutoETS models
In our last post, we deployed AutoETS across our S&P 500 revenue dataset and compared results to our typical benchmarks, the naive, autoregressive (AR(1)), and autoregressive growth (AR%(1)) models. AutoETS performed remarkably well—error rates dropped 2% points vs the best performing AR%(1) model. This welcome performance notwithstanding, it would be worthwhile to see what the distribution of models chosen turned out to be. First, imagining we had a stakeholder to whom we must communicate our findings, this would provide a bit more detail around what's going on underneath the hood. Second, to see if AutoETS reveals something about the data that improves our intuition. For example, say we used an AAA model (additive Error, Trend, and Seasonality equations) to generate forecasts. But then AutoETS found another model, say MNN (multiplicative error, no Trend or Seasonality equations) that performed better.
On first glance, this might be a counter intuitive result, so we'd like to understand why this is the better model. We'd want to size the performance improvement. Is it meaningful? Could it simply be due to randomness. If it is better, does the underlying logic of state space models reveal a new intuition about the data generation process? For example, AutoETS might choose multiplicative over additive errora. This might suggest that relative errors are more relevant for our time series. Why relative? If the actual data are increasing—something not unlikely in sales data (we certainly would like to see companies we want to invest in enjoying increasing sales)—then errors are likely to increase with that process. Hence, the error relative to the size of the forecast—or multiplicative errors—is more appropriate.1
We've actually been leading the discussion in the direction of multiplicative errors for a reason, which will be revealed shortly. Let's iterate through S&P 500 revenue dataset using AutoETS to find the best model. We’ll then graph the relative frequency of those models below.
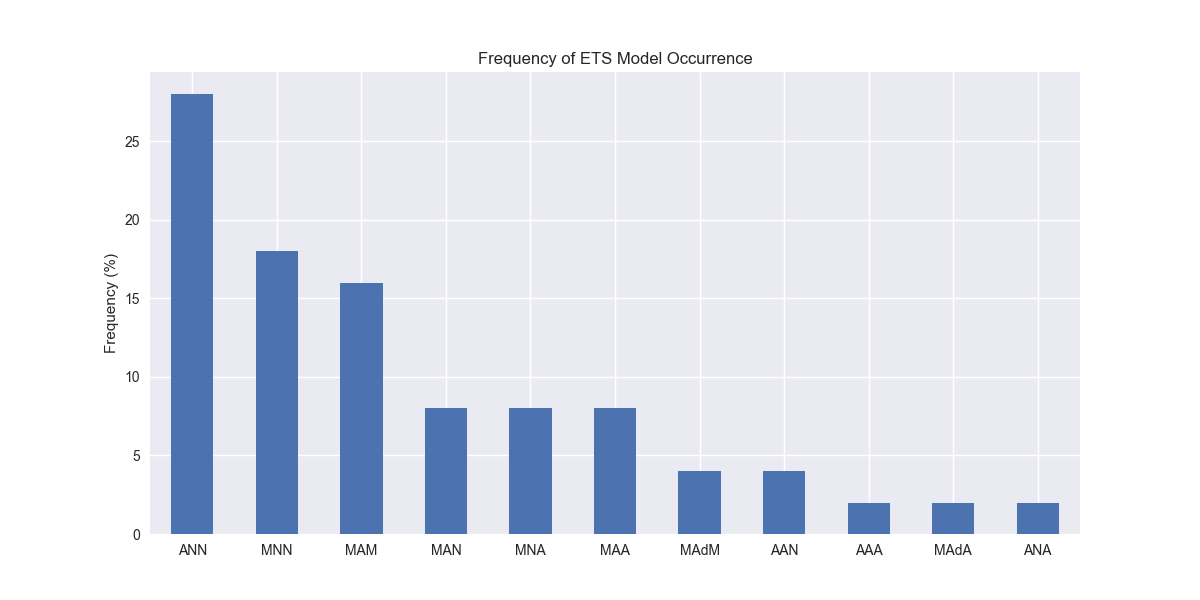
Interestingly, the ANN model (additive error, no trend, and no seasonality) enjoys the highest frequency at close to 30% of the model versions. Pretend like you don’t see the “Ad” abbreviation for two of the models—we’ll explain that later. But do notice that multiplicative errors seem prevalent across many models. Indeed, when we calculate the relative frequency of error types across all the models, we find that multiplicative errors are used in over 60% of the models, as shown in the graph below.
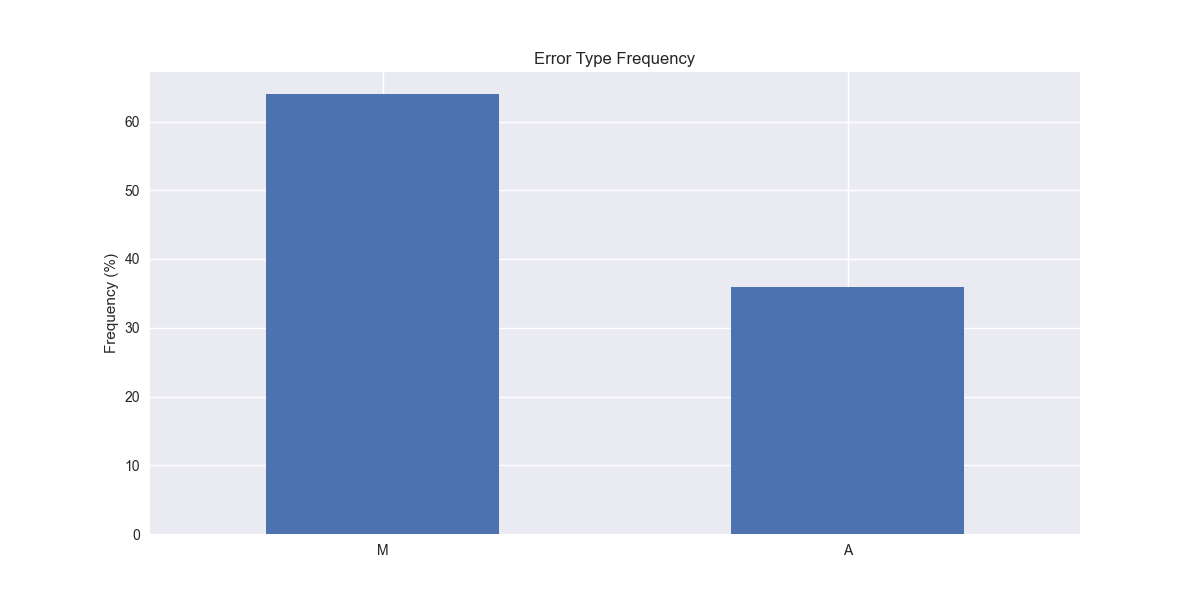
Given what we've discussed above on the relevance of multiplicative errors for increasing sales, that should make intuitive sense, assuming that most of the companies in our data set saw increasing sales for the training period. We’d definitely need to confirm this. In our next post, we'll examine the frequency of different equations for the trend and seasonality portions of the ETS models. Stay tuned!
Code below
# Load packages
import numpy as np
import pandas as pd
from datetime import datetime, timedelta
import statsmodels.api as sm
import matplotlib.pyplot as plt
from matplotlib.ticker import FuncFormatter
import matplotlib as mpl
import pickle
from statsmodels.tsa.exponential_smoothing.ets import ETSModel
from sktime.forecasting.ets import AutoETS
from collections import Counter

# Assign chart style
plt.style.use('seaborn-v0_8')
plt.rcParams["figure.figsize"] = (12,6)

# Handy functions
# Functions to load and save files
def save_dict_to_file(data, filename):
    with open(filename, 'wb') as f:
        pickle.dump(data, f)

def load_dict_from_file(filename):
    with open(filename, 'rb') as f:
        return pickle.load(f)

# Create functions for indexing
def create_index(series):
    if series.iloc[0] > 0:
        return series/series.iloc[0] * 100
    else:
        return (series - series.iloc[0])/-series.iloc[0] * 100

# Function for scaled RMSE
def get_rmse_scaled(series):
    return np.sqrt(np.mean((series['actual']-series['predicted'])**2))/np.mean(series['actual'])

# Function to flatten
def flatten_df(dataf: pd.DataFrame, group_name:str, cols:list) -> pd.DataFrame:
    df_grouped = dataf.groupby(group_name)[cols].agg(list)

    for col in cols:
        df_grouped[col] = df_grouped[col].apply(lambda x: np.concatenate(x))

    df_long = df_grouped.apply(pd.Series.explode).reset_index()

    return df_long

# Symbols used
etf_symbols = ['XLF', 'XLI', 'XLE', 'XLK', 'XLV', 'XLY', 'XLP', 'XLB', 'XLU', 'XLC']

ticker_list = ["SHW", "LIN", "ECL", "FCX", "VMC",
               "XOM", "CVX", "COP", "WMB", "SLB",
               "JPM", "V", "MA", "BAC", "GS",
               "CAT", "RTX", "DE", "UNP", "BA",
               "AAPL", "MSFT", "NVDA", "ORCL", "CRM",
               "COST", "WMT", "PG", "KO", "PEP",
               "NEE", "D", "DUK", "VST", "SRE",
               "LLY", "UNH", "JNJ", "PFE", "MRK",
               "AMZN", "SBUX", "HD", "BKNG", "MCD",
               "META", "GOOG", "NFLX", "T", "DIS"
]

xlb = ["SHW", "LIN", "ECL", "FCX", "VMC"]
xle = ["XOM", "CVX", "COP", "WMB", "SLB"]
xlf = ["JPM", "V", "MA", "BAC", "GS"]
xli = ["CAT", "RTX", "DE", "UNP", "BA"]
xlk = ["AAPL", "MSFT", "NVDA", "ORCL", "CRM"]
xlp = ["COST", "WMT", "PG", "KO", "PEP"]
xlu = ["NEE", "D", "DUK", "VST", "SRE"]
xlv = ["LLY", "UNH", "JNJ", "PFE", "MRK"]
xly = ["AMZN", "SBUX", "HD", "BKNG", "MCD"]
xlc = ["META", "GOOG", "NFLX", "T", "DIS"]

sectors = [xlf,  xli,  xle,  xlk, xlv,  xly, xlp, xlb, xlu, xlc]

# Sector dictionary
sector_dict = {symbol.lower(): tickers for symbol, tickers in zip(etf_symbols, sectors)}
sector_map = {ticker.lower(): symbol for symbol, tickers in zip(etf_symbols, sectors) for ticker in tickers}

# Load data from disk
# See Code Walk-Throughs for how we built the data set
df_sector_dict = load_dict_from_file("hello_world/data/simfin_df_rev_dict.pkl")

# Clean dataframes
df_rev_index_dict = {}
for key in sector_dict:
    temp_df = df_sector_dict[key].copy()
    col_1 = temp_df.columns[0]
    temp_df = temp_df[[col_1] + [x for x in temp_df.columns if 'revenue' in x]]
    temp_df.columns = ['date'] + [x.replace('revenue_', '').lower() for x in temp_df.columns[1:]]
    temp_idx = temp_df.copy()
    temp_idx[[x for x in temp_idx if 'date' not in x]] = temp_idx[[x for x in temp_idx if 'date' not in x]].apply(create_index)
    df_rev_index_dict[key] = temp_idx

# Create train/test dataframes
df_rev_train_dict = {}
df_rev_chg_train_dict = {}
df_rev_test_dict = {}
for key in df_rev_index_dict:
    # Create ticker list
    tickers = [x.lower() for x in sector_dict[key]]

    # Create dataframe fo all
    df_out = df_rev_index_dict[key]

    # Base train df
    df_train = df_out.loc[df_out['date'] < "2023-01-01"].copy()
    df_rev_train_dict[key] = df_train

    # Chang train df
    df_train_chg = df_train.copy()
    df_train_chg[tickers] = df_train_chg[tickers].apply(lambda x: np.log(x).diff())
    df_train_chg = df_train_chg.dropna()
    df_rev_chg_train_dict[key] = df_train_chg

    # Test df
    df_rev_test_dict[key] = df_out.loc[df_out['date'] >= "2023-01-01"]

# Create trend models
auto_ets_models = {}
model_type = pd.DataFrame(columns=['sector', 'ticker', 'type'])
count = 0
for key in df_rev_chg_train_dict:
    tickers = [x.lower() for x in sector_dict[key]]
    df_train = df_rev_train_dict[key]
    auto_ets_models[key] = {}
    for ticker in tickers:
        try:
            model = AutoETS(
                auto=True,
                n_jobs=-1,
                sp=4
            ).fit(df_train[ticker])

        except ValueError as e:
            print(f"{ticker} fails due to {e}")

        auto_ets_models[key][ticker] = model
        summary_table = model.summary().tables[0]
        model_string = summary_table.data[1][1]  # This gets a string like 'ETS(AAA)'
        ets_type = model_string[model_string.find("(") + 1:model_string.find(")")]

        model_type.loc[count] = [key, ticker, ets_type]
        count += 1

# Plot model types
(model_type['type'].value_counts(normalize=True).sort_values(ascending=False)*100).plot(kind='bar',  rot=0)
plt.xlabel("")
plt.ylabel("Frequency (%)")
plt.title("Frequency of ETS Model Occurrence")
plt.show()

# Plot frequency of Error Types
(model_type['type'].apply(lambda x: x.split()[0][0]).value_counts(normalize=True).sort_values(ascending=False)*100).plot(kind='bar',  rot=0)
plt.xlabel("")
plt.ylabel("Frequency (%)")
plt.title("Error Type Frequency")
plt.show()While this may seem like another example of confusing statspeak, the reason it is called multiplicative is because the forecast gets multiplied by the error term (actually 1 + error).